


In 2018 China was by far the biggest buyer of the Polish goods in terms of value. China however occupied distant places among the top 10 Polish export Asian destinations in terms of the export dynamics, exports per capita and propensity to purchase Polish goods. Imports from Poland were much more attractive for Vietnamese, Korean, Taiwanese, Thai or Malaysian buyers than for the Chinese. Lower relative attractiveness of Polish goods in the Chinese market in comparison to other Asian markets is not a new phenomena and it draws several conclusions. Firstly, the in-depth market analysis and market research shall be conducted before bearing any significant costs of entering the Chinese market. Secondly, the sheer size of the Chinese market and the annual value of the Polish exports growth still make China the important export destination but exporters should also analyse opportunities offered by other Asian markets and consider concurrent expansion in other countries . Thirdly, if the prospect benefits of entering Chinese market are outweighed by costs then other Asian markets should be considered as the first choice as it’s possible that they can offer better opportunities. Successful placement of products in Korea, Japan, or Taiwan can be later used as a bridge to China if the market situation changes.
Value and growth dynamics of the Polish exports to China and other Asian countries
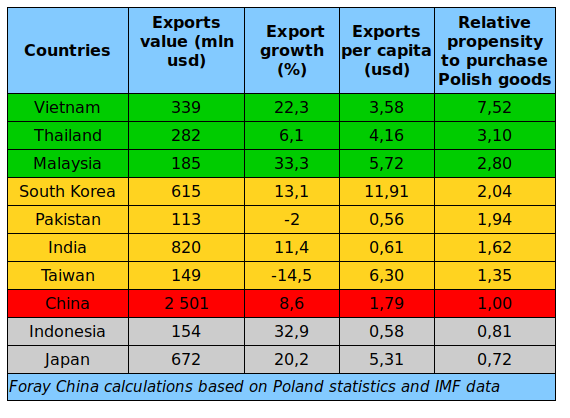
According to Statistics Poland 2,5 bln usd worth goods usd were last year exported from Poland to China. Exports to India, second largest destination in Asia, were three times smaller. Exports to Korea and Japan were each worth a quarter of the exports to the Chinese market. China was also a leader in terms of annual export growth with amount nearing 200 mln usd. The distance to other countries was however much smaller as Japan trailed China with 113 mln usd and India with 84 mln usd of the annual export growth. In terms of export growth dynamics China was greatly outpaced by the majority of the Polish top partners in Asia. While exports to China grew 8,6 pc. the exports to Malaysia and Indonesia were over 30 pc higher yoy and growth rates for Japan and Vietnam exceeded 20 pc yoy. China recorded higher export growth when compared only to three countries: Taiwan, Pakistan and Thailand. Export growth dynamics to Taiwan and Pakistan was negative, exports to Thailand grew 6,1 pc yoy. Value and growth dynamics of Polish export to 10 top Asian buyers is presented in the table below.
Indirect exports from Poland to Asia
The Middle East countries, belonging to the MENA grouping and former soviet republics in Central Asia has not been included. Singapore and HK have been also excluded form the ranking. Both are important international logistics hubs and international trade centres serving as the export bridges to other countries and it is difficult to estimate the value of goods that are not re-exported to other markets. In 2018 Polish exports to Hong Kong reached amount of 426 mln usd, 5 pc less than in 2017. Exports to Singapore increased 15 pc yoy and reached 279 mln. On the one hand Hong Kong to some extent serves as a gate for some Polish exports to China so the volume of the Polish goods that flow into the Chinese market can be higher. On the other hand the share of refined copper in Polish export to China exceeded 20 pc. Polish export to India was dominated by regular coke with 30 pc share. Export to other Asian countries was based on more processed and higher value goods or on the food products. If the raw materials such as regular coke or roughly processed raw materials such as refined copper were excluded from the calculation presented in the table, the value of Polish exports and related attractiveness of the Polish goods in the Chinese and Indian market would be much lower. The indirect export trough the other third countries such as e.g. Germany, Netherlands is not included in the calculations.
Propensity to import goods from Poland
Due to the sheer size of their economies China, Japan and India are natural leaders as the destinations for Polish export. However evaluating market attractiveness and export prospects other data shall be factored in. Exports value per capita show the value of Polish goods shipped to average buyer in the destination markets. In 2018 China was ranked 6th out of then top countries with 1.79 usd per capita surpassing only India, Indonesia and Pakistan. South Korea was the unquestionable leader with almost 12 usd per capita. Exports per capita to Taiwan, Japan and Malaysia were over three times higher than to China. Korea, Taiwan and Japan are high income countries, Malaysia is middle income country. GDP per capita in Japan is twenty times higher than in India and fifteen times higher than in Vietnam while both countries are among the top Asian buyer of Polish goods.
The gap between poorer countries and Korea is only slightly smaller. GDP per capita in Malaysia and Thailand is also relatively low comparing to the richest Asian players. Considering the prospects of the Polish export in the coming years it is also important to evaluate the relative attractiveness of the Polish goods in specific markets. Economies of India, Vietnam and Indonesia are fast growing. As the buyers in those market are willing to purchase more Polish goods now under the much more limited purchasing power while compared the buyers in rich countries then it’s possible that in the future the presence and relative popularity of the Polish goods in their markets will be a driver of the the quick growth of exports propelled by the increasing wealth of buyers.
The relative propensity to purchasing Polish goods by the buyers in various countries compared to the propensity of the Chinese buyers can be measured using the relative purchase propensity index with the following formula. (export per capita from Poland to country A/export per capita to China) / (GDP per capita in country A/GDP per capita in China) The mapping of top Asian importers of Polish goods in terms of exports value, exports per capita and propensity to purchase Polish goods is presented on the diagram below:
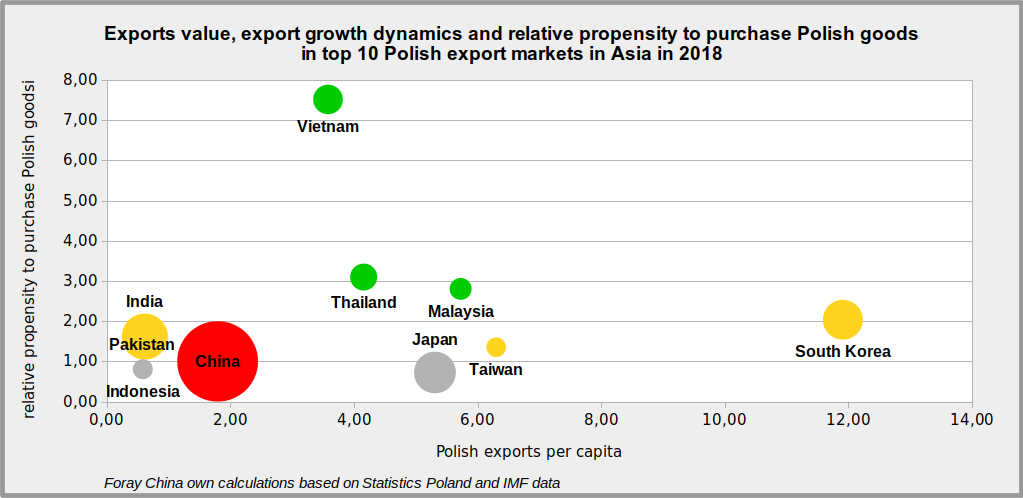
The values of the import propensity index are presented in the previous table. The attractiveness of the specific market for Polish exporters can be preliminary evaluated using the combination of the exports per capita value and propensity index with total exports value as a moderating factor. This evaluation and ranking should not replace the in depth sectoral analysis and market researches combined with various tools applied in comparative evaluation of the export markets but can be a first step on the path to the selection of the most promising export markets.
Vietnam is unquestioned leader in terms of value of goods imported from Poland when compared to the purchase power and country’s wealth level. South Korea outranks other countries in terms of Polish exports per capita combined with quite high relative propensity to purchase Polish goods. Both countries are distinct outliers on the map of Poland’s export destinations in Asia when compared to China. Taiwan, Thailand and Malaysia form a grouping of buyers strongly attracted by the Polish goods. Japanese market seem to be only slightly more attractive market than the Chinese mainly due to high per capita exports. India and Pakistan are comparable to China in terms of exports per capita and propensity to purchase Polish goods but the export volume weighs on in favour of China. The only country, that clearly lags behind China is Indonesia but as the export dynamics gained momentum last year the situation can change in the coming years. Markets in South East Asia are quickly opening for the flow of Polish goods and the intensive efforts made by PAIH offices in the region seem to bring tangible effects.