


Łukasz Sarek
February 10, 2023
Key findings:
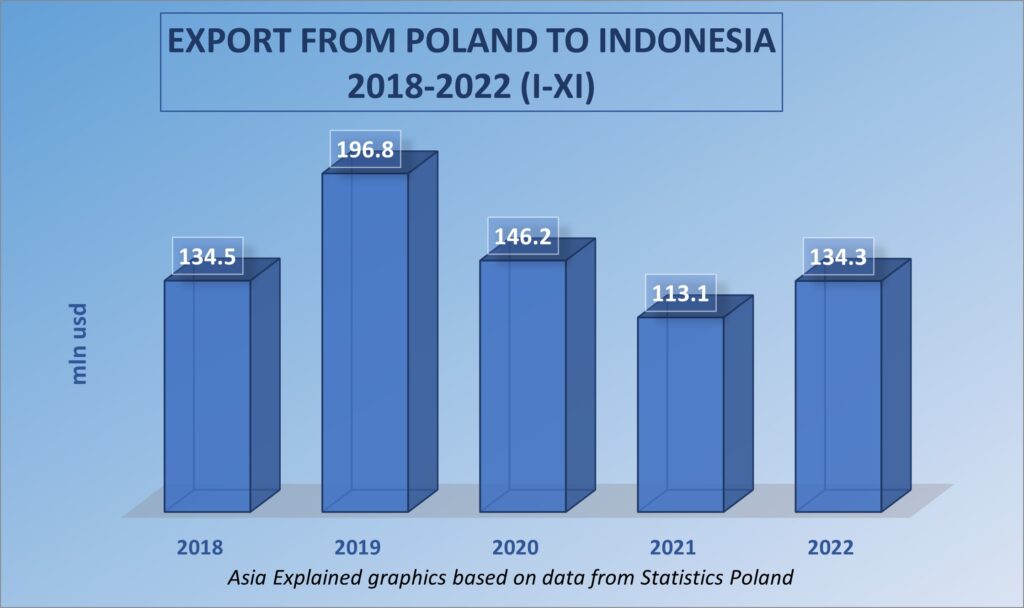
Polish exports to Indonesia in January-November 2022 increased by 18.8 per cent yoy, reaching USD 134.3 billion. This amount was lower than that recorded in the corresponding period of 2020, and much lower than exports in 2019.
Polish exports to Indonesia in 2022 were much lower than exports to other East and Southeast Asian markets like Vietnam, Thailand and Malaysia. Given the favourable macroeconomic environment last year, this may indicate a missed opportunity to exploit the export growth space.
Polish exports to the Indonesian market were concentrated in a few main product groups. Goods belonging to three groups at the HS chapter level – mechanical machinery and equipment, electrical machinery and equipment and dairy products – accounted for 58% of the value.
At HS heading level, exports were also concentrated in a limited number of product groups. Two groups accounted for the lion’s share: whey and machinery for paper and paperboard production and processing. Together they accounted for 1/5 of Polish exports to Indonesia. Another five items accounted for almost 30% of the value of Polish exports to Indonesia.
Exports to Indonesia were characterised by high volatility compared to 2021. Despite the overall increase in exports, there were very significant declines in many items, which were offset by dynamic export growth in other product groups. The ratio of absolute values of positive export growth to negative growth was 1.58.
The macroeconomic environment for Polish exports to Indonesia in 2023 will be favourable. Positive factors will include a relatively high economic growth rate, rising imports, falling inflation and a stronger rupiah. The high vaccination rate of the population will reduce the negative impact of possible subsequent pandemic waves.
The impact of favourable macroeconomic factors is mitigated by high interest rates and other components of restrictive monetary and fiscal policies. Foreign exporters also continue to face informal market access barriers, which vary by industry and product group.
Growth in Polish exports to Indonesia
According to the Statistics Poland (CSO), Polish exports to Indonesia in January-November 2022 amounted to usd 134.3 billion, up 18.8 percent compared to the same period in 2021. However, this value was lower than the 146 million usd recorded in the pandemic year of 2020 and much lower than the 197 million usd in 2019. Polish exports to Indonesia have also grown less than total Indonesian imports over the past two years. In 2022, the total value of imports to Indonesia of goods other than oil and gas amounted to USD 197.1 billion. This is almost 15.5 per cent higher than in 2021 and about 54.5 per cent higher than in 2020.
The growth rate of the Indonesian economy in 2022 was 4.8 per cent. The pillars of growth were investment, consumption and exports. Dynamic growth in these three areas was tempered by a decline in government spending. The less active fiscal policy was accompanied by a significant reduction in financial support programmes to combat the effects of the pandemic. However, despite an unfavourable rupee-dollar exchange rate and rapidly rising inflation for most of the year, Polish exports grew. The value of the rupee against the dollar fell by almost 10 per cent in 2022. Consumer inflation rose dynamically from 2.2 per cent in January to 5.95 per cent in September. Only in the last quarter did it begin to slow. In December it stood at 5.51 per cent. Polish exports to the Indonesian market were also much lower than those to other East and Southeast Asian markets such as Vietnam, Thailand and Malaysia.
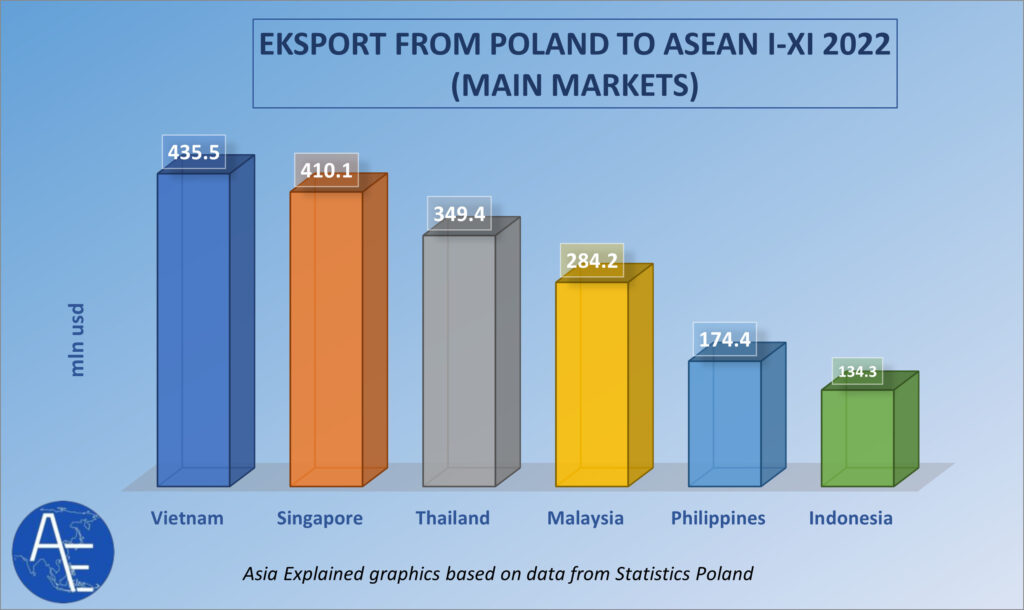
Indonesia is ASEAN’s largest economy, only slightly behind in terms of nominal GDP value in 2021. After Spain and Mexico, Indonesia is one of the 20 largest economies in the world. It also ranks 31st in the world in terms of import value. In the ASEAN bloc, Indonesia ranked fifth as an importer in 2021, located between Malaysia and the Philippines. Indonesia’s ratio of exports to GDP is much lower than that of other leading ASEAN economies, standing at 22.6 per cent in 2022. This ratio is expected to fall to 21.7 per cent in 2023. The Indonesian economy is less open than the economies of Singapore and Malaysia, or even Vietnam and Thailand, and it is not an easy market for foreign exporters. However, even taking these factors into account, the realisation of a lower export value in 2022 than in 2020, let alone 2019, with an improving macroeconomic environment, may be an indication that Polish exports to Indonesia have not taken advantage of the room for growth.
Growth in Polish exports to Indonesia
Poland’s exports to Indonesia in 2022 were concentrated in several main product groups. In the eleven months of last year, 58 percent of Polish exports to the Indonesian market consisted of goods belonging to three gropups at the HS chapter level: machinery and mechanical equipment (43.5 million usd and 32.4 percent share), electrical machinery and equipment (19.5 million usd and 14.5 percent share) and dairy products (almost 14.2 million usd and 10.6 percent share). The next three divisions together accounted for 19 per cent of exports.

There is clearly a strong concentration of exports in a small number of chapters, with the vast majority having a low value and a negligible share of total exports.
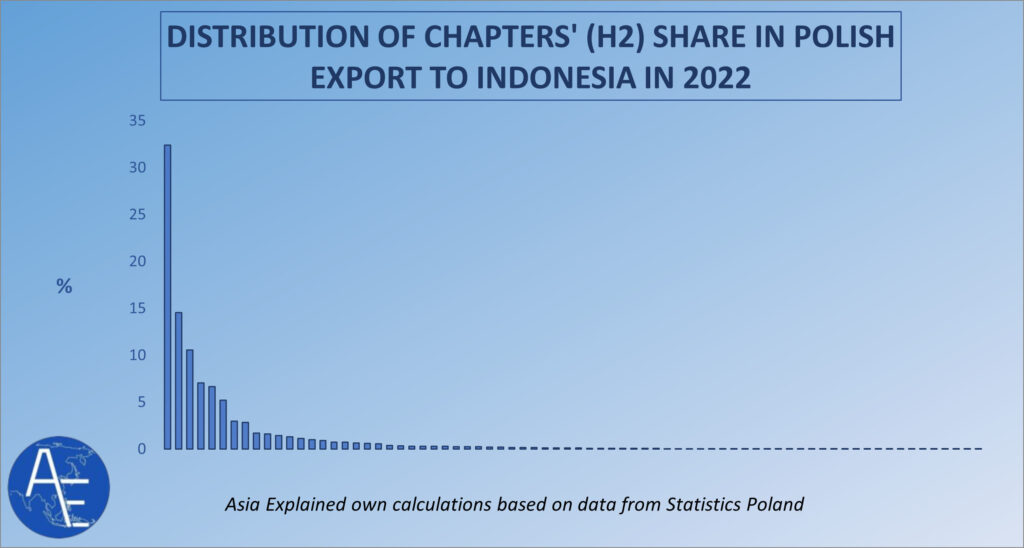
The Harmonised Commodity Description and Coding System (HS) covers 97 chapters. In 2022, in 37 chapters export amount was reported as between 0 and 10 thousand usd. In 18 chapters, the value of exports was between USD 10 000 and USD 100 000. Together, these chapters accounted for 0.63% of exports. Another 26 chapters had an export value between 100 thousand and 1 million usd, accounting for a total of 7.13 per cent. Only 16 chapters had an export value of more than usd 1 million, and together these chapters accounted for more than 92 per cent of exports.
The concentration of exports at the chapter level is very high. Due to the different ‘capacities’ of the chapters in terms of product groups, analysis at this level may not fully reflect the low exports diversification. The chapter with machinery and equipment covers a broad and highly diversified group of products, much broader than, for example, the chapter covering only fertilisers. Export concentration should therefore also be assessed at the heading level.
The structure of Polish exports to Indonesia at the heading level
The HS covers more than 1 200 headings. In January-November 2022, exports of more than usd 1 000 were recorded in only 306 headings. Exports with a value between 1 000 and 10 000 usd were recorded in 97 headings. The upper limit of this range is determined by the value of small exports, which may include sample batches, small batches of very low value goods, or isolated cases of small occasional exports. Exports with a value between USD 10 000 and USD 100 000, involving mainly single orders or larger shipments but goods of low value, were recorded in 102 headings. Exports of between usd 100,000 and usd 1 million were recorded in 80 headings. Exports worth more than USD 1 million were recorded in only 27 headings. The graph below shows the share of these groups in the total value of exports.
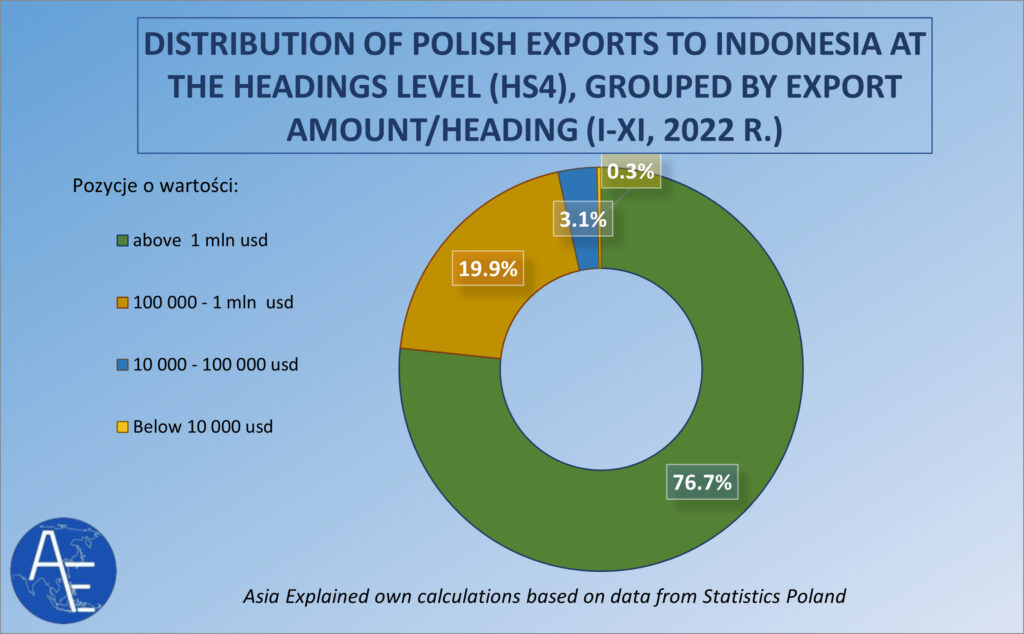
The 27 headings with a value of more than USD 1 million account for 2 per cent of the total number of headings in the HS system, and for 8.8 per cent of the headings in which exports to Indonesia had value of more than USD 1 000 . Those 27 headings accounted for 76.7 per cent of exports. In order to better illustrate the degree of concentration of Polish exports to Indonesia, the following graph shows the distribution of the share of individual headings in the value of exports. Headings with exports above USD 100 thousand are included in the graph.
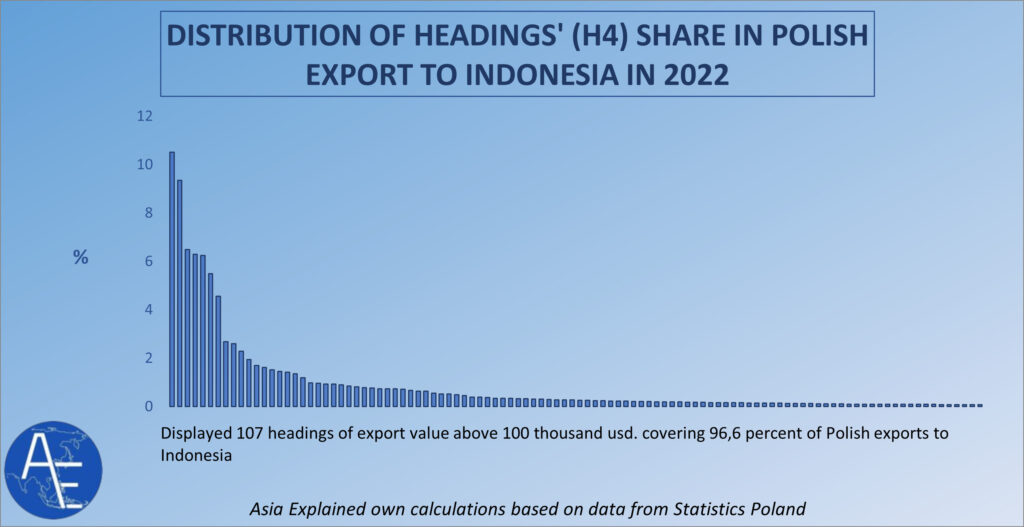
In terms of export share, only two headings are by far the most important: whey, with a share of 10.5 per cent, and machinery for the production and processing of paper and paperboard, with a share of 9.4 per cent. This means that a fifth of Polish exports to Indonesia last year was concentrated in just two items. Also prominent headings were casein products, including adhesives (6.5 percent), machinery and equipment for special applications (6.3 percent), malt extract and some processed flour, groats, etc. (6.2 percent), graphite electrodes and brushes and other graphite products (5.5 percent), and rubber products (4.5 percent). Together, these five product groups accounted for almost 30% of the value of Polish exports to Indonesia. The remaining product groups have a small and clearly declining share.
Growth dynamics of Polish exports to Indonesia at the heading level
At the heading level, the growth dynamics of Polish exports to Indonesia varied considerably. Despite the overall increase in exports, there were very significant declines in many items, which were offset by dynamic export growth in other groups of goods. The number of headings with an export value of more than USD 100 thousand in January-November 2021 or same period in 2022 was 126. Export growth was recorded in 71 headings, or 53.3 per cent of the headings in this group of 126 headings. Declines were recorded for 55 items, or 46.7 per cent of the headings with exports of more than USD 100 000. The graph below shows the distribution of changes in the value of export growth in the group of headings with an export value of more than 100 thousand usd achieved in the 2021 or 2022 survey period.
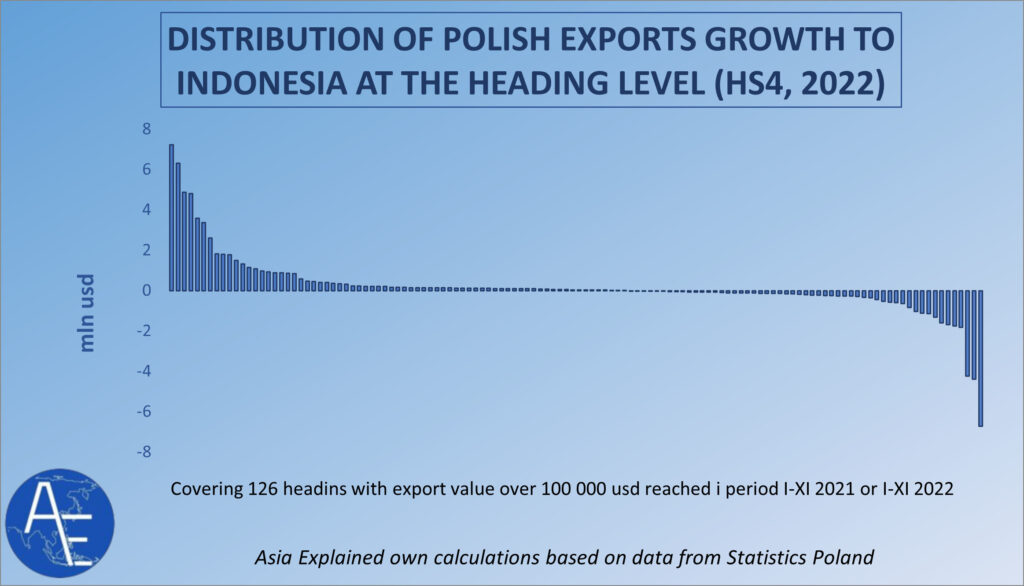
The total change in the value of exports at the heading level, understood as the sum of the absolute values of positive and negative export growth, amounted to USD 92.6 million. The total increase in the value of exports in headings with positive growth was about USD 56.8 million. Negative export growth amounted to USD 35.8 million. The ratio of the absolute values of positive growth to negative growth was 1.58. These data, together with the numbers of headings with positive and negative growth presented above, indicate a high volatility in the structure of Polish exports to Indonesia.
The most important headings, where export growth was achieved, ranked by the value of the growth, are as follows:
1. machinery and mechanical equipment for special functions (+USD 7.2 million, up 585 per cent).
2. graphite electrodes and brushes and other graphite products (+USD 6.3 million, up 596 per cent).
3. machinery for paper and paperboard production and converting (+USD 4.9 million, +63%).
4. casein products including adhesives (+USD 4.8 million, up 123%)
5. lifting, handling and loading equipment (+3.6 million usd, up just over a dozen thousand usd in 2021)
6. electronic integrated circuits (+3.4 million usd, only 2119 thousand usd in 2021)
The main headings in which exports declined, ranked by the value of the decline:
1. iron and steel scrap (-6.7 million usd, down 77.5%).
2. iron and steel structures, plates, bars, profiles, etc. (-4.4 million usd, down 86 percent).
3. non-concentrated milk and cream (-4.2 million usd, down 100 per cent).
Significant decreases in export value were also recorded for products such as whey, industrial equipment for thermal processing of materials and heating of water, tobacco, mineral fertilisers, fish meal and diagnostic reagents.
Prospects for Polish exports to Indonesia
The macroeconomic environment for Polish exports to Indonesia in 2023 will be favourable. According to the Asian Development Bank (ADB), Indonesia’s economic growth is expected to reach 4.8 per cent, and analysts at Indonesia’s central bank believe it could be as high as 5.5 per cent. In ASEAN, Indonesia will be one of the fastest growing economies after Thailand and the Philippines. Imports are expected to grow by 11 per cent. Average inflation in 2023 will be relatively high at 4.5-5 per cent, but on a declining trend. It could fall to 3.7 percent by the end of the year. A large part of the Indonesian population has been vaccinated, so the impact of the epidemic on the most sensitive industries should be limited.
The exchange rate is currently favourable for exports to Indonesia. In January the rupiah appreciated by 4.26 per cent against the dollar. Slowing inflation gives room for further appreciation of the Indonesian currency, which is favourable for Polish exporters. However, rising interest rates in the world’s leading economies, where central banks are trying to curb inflation, could have a negative impact on the rupiah’s value against the dollar. Indonesia’s central bank is also keeping interest rates high. In January it raised them to 5.75 per cent. The simultaneous tight monetary and fiscal policies are keeping inflation in check, but also dampening consumption and investment. This is reflected in the demand for imported consumer and industrial goods. Foreign exporters also continue to face non-tariff barriers to market access, the extent of which varies by industry and product group.